This article covers the basics of Shopify Analytics & Reporting. To learn more, check out Shopify’s full Beginner’s Guide to Shopify Reports and Analytics by Shanelle Mullin, or download Shopify’s free eBook Ecommerce Analytics for Absolute Beginners.
The Iceberg Theory
Over 90% of an iceberg’s volume and mass is underwater. What you see from the shoreline is only a fraction of what exists just below the surface.
In eCommerce, your data is much like an iceberg. Data is one of the most powerful tools an internet retailer can use. If your store is on the Shopify platform, it’s pretty easy to spot a few shiny surface metrics and determine if they’re up or down. “Traffic is up 8% over last week.” This sounds good, yet it doesn’t tell the full story. There’s a whole lot more going on underneath.
Data analysis is the process of digging below the surface. With persistence you can find:
- Answers to meaningful business questions
- Issues or concerns that might be costing you money
- Opportunities to improve your user experience or conversion rate
By tracking and studying your metrics, you can uncover the what, why, and what to do for your eCommerce store. The term “data analytics” can be intimidating, but don’t let it deceive you. Just about anyone can understand the basics and do it successfully. All you need are the right tools and time.
Questions, Questions, More Questions
How do you turn your data into practical, effective site changes? The first step is to get curious. Before you look at any data, identify a question to ask. Here are some examples:
1. Are my sales up or down compared to last year?
2. Did I reach my revenue goal?
3. Which traffic sources contributed the most/least to the success/failure of my goals?
4. Was there a significant gain or loss in a specific area? Can we determine the cause?
Asking yourself specific questions will give you purpose and direction as you explore your data.
Question-Asking Tips
There are two important points to keep in mind when asking yourself questions:
1. Don’t compare apples to oranges; use your own historic data.
2. Keep digging.
Tip 1: Apples to Oranges – The Problem With Industry Benchmarks
Pop quiz time: What’s a good conversion rate?
There are two ways to answer. Your reflex may be to look outside your store. You could hit Google for some research, check out industry reports, or turn to benchmarking tools in Google Analytics.
But comparing your data to industry benchmarks is more entertaining than actionable. For example, say your research shows that your conversion rate is higher than the industry average. Great! But does that actually answer your question? If the industry conversion rate is lower than yours, it’s obviously not a good conversion rate for you to aim for!
That’s why we always recommend looking inward instead of outward. Use your own historic data as a benchmark. Success is all about making incremental changes over time. A good conversion rate is simply one that’s higher than it was last month. Because your store and customers are unique, only your own data can tell you what your numbers should be.
Tip 2: Keep Digging – The Power of the Follow-Up
Don’t be content with one layer of questions; keep digging. Once you identify a question to explore, let it lead you into more detailed questions. The first answers you reach will often only tell you the what. Keep going until you feel confident you’ve uncovered the why and the what next.
A Practical Example
Let’s say that social media drives a significant portion of your revenue. You ask yourself “Are my social media-driven sales up or down?” After checking out your historical data, you see that it’s down 10% year over year.
A good follow-up question might be, “Are all social media platform sales down?” Again you look at your own data. Revenue has increased from all social media platforms except Facebook. You’ve narrowed your scope and now you can dig even deeper.
Your next question is “How many times did we post on Facebook this year versus last year?” You find that you posted on Facebook 80 times this year and 100 times last year. That’s 20% less than the previous year.
You conclude that the decrease in number of Facebook posts played a role in decreasing your revenue from Facebook. You take this to the team, and everyone agrees to ramp up the number of Facebook posts.
After putting this plan in action, you can check your numbers again and test your theory. By comparing your own historical data to your current data, you identified a problem. By asking a series of questions, you were able to create an informed theory and take practical steps to increase your revenue.
Shopify Reports Basics
Now let’s get into some basics of Shopify reports. Different reports are available to you depending on your Shopify plan. Everyone has access to the Overview dashboard and the Finances reports. The Basic Shopify plan and above have access to additional reports: Acquisition, Behavior, and Marketing.
1. Acquisition Reports
Acquisition Reports focus on visitors to your website. It’s worth noting that one visitor can generate multiple visits, and a visit automatically ends after 30 minutes of inactivity or at midnight.
You can find the following reports under Analytics > Reports > Acquisition.
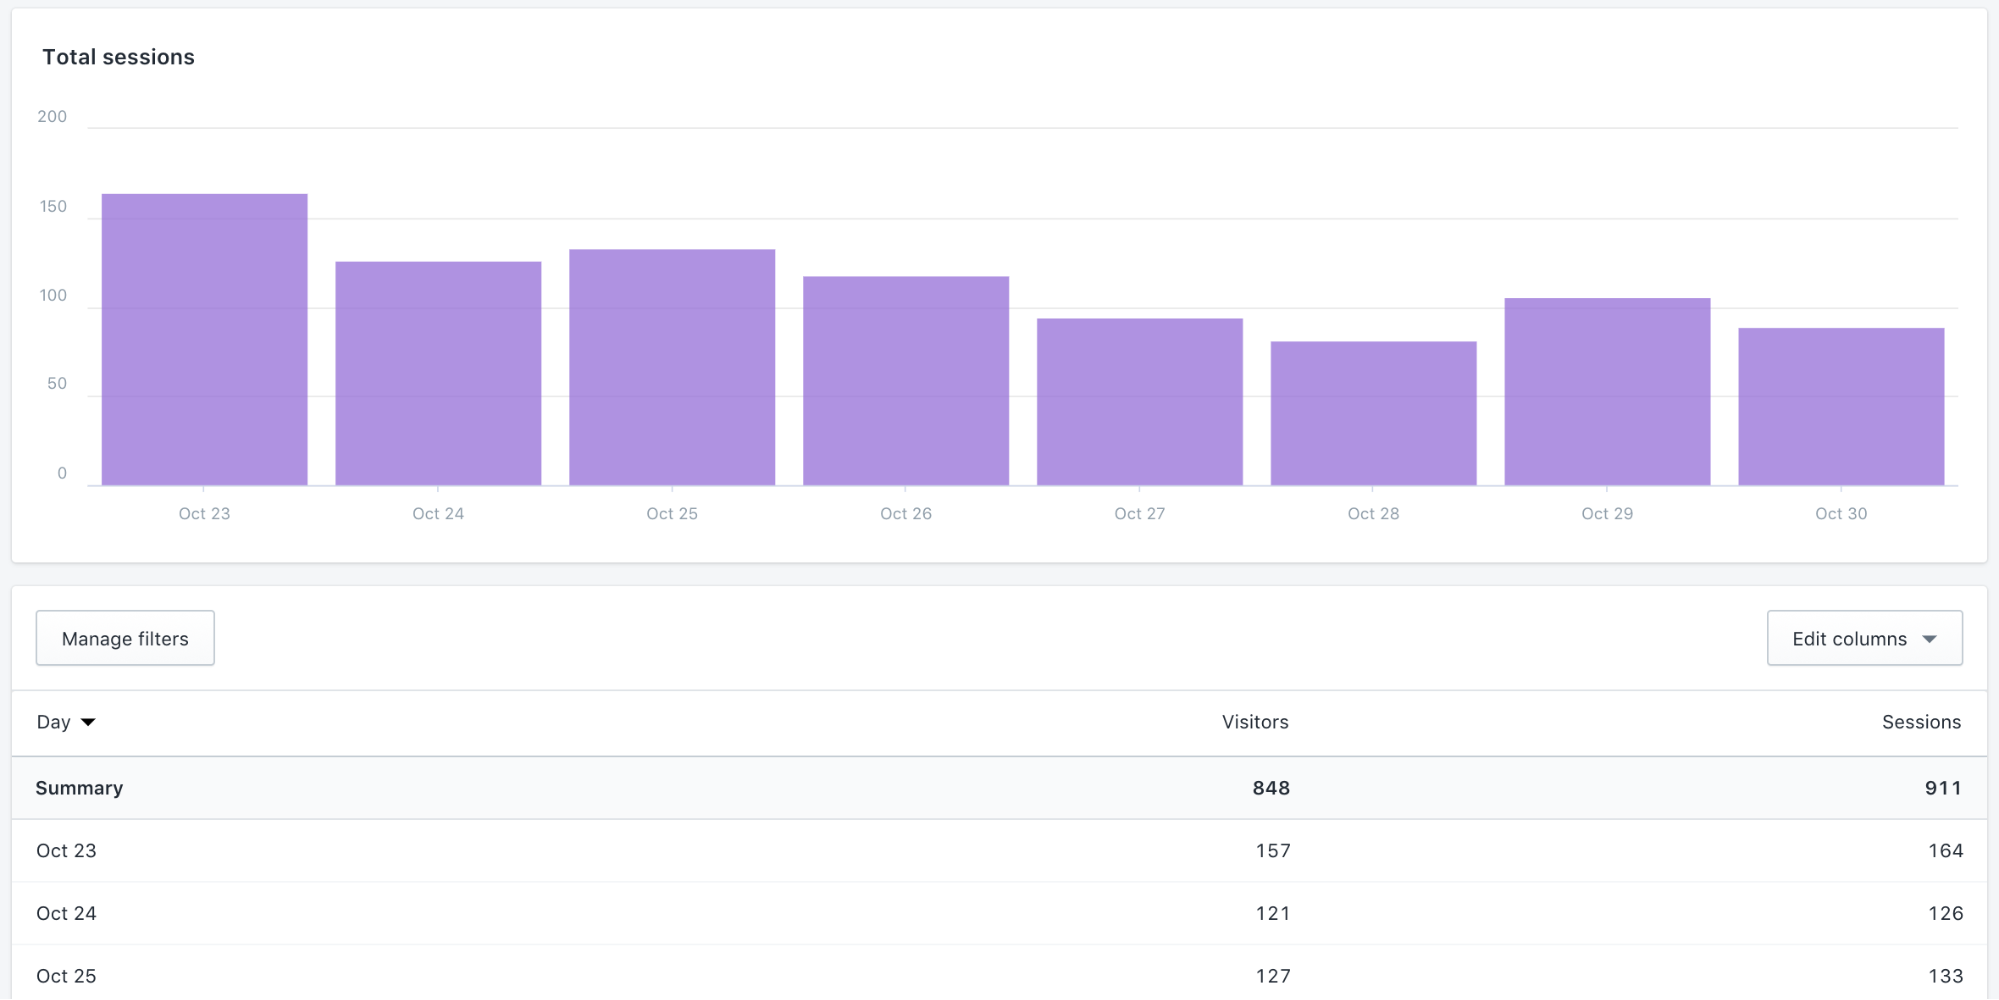
Visits Over Time
Visits Over Time shows you the number of visitors and sessions during the specified time period.
(source)
You can dig into the data by adjusting the time period or by sorting the columns in the table. Day-to-day data tends to fluctuate. You’ll need to look at longer time periods like months or quarters to uncover trends.
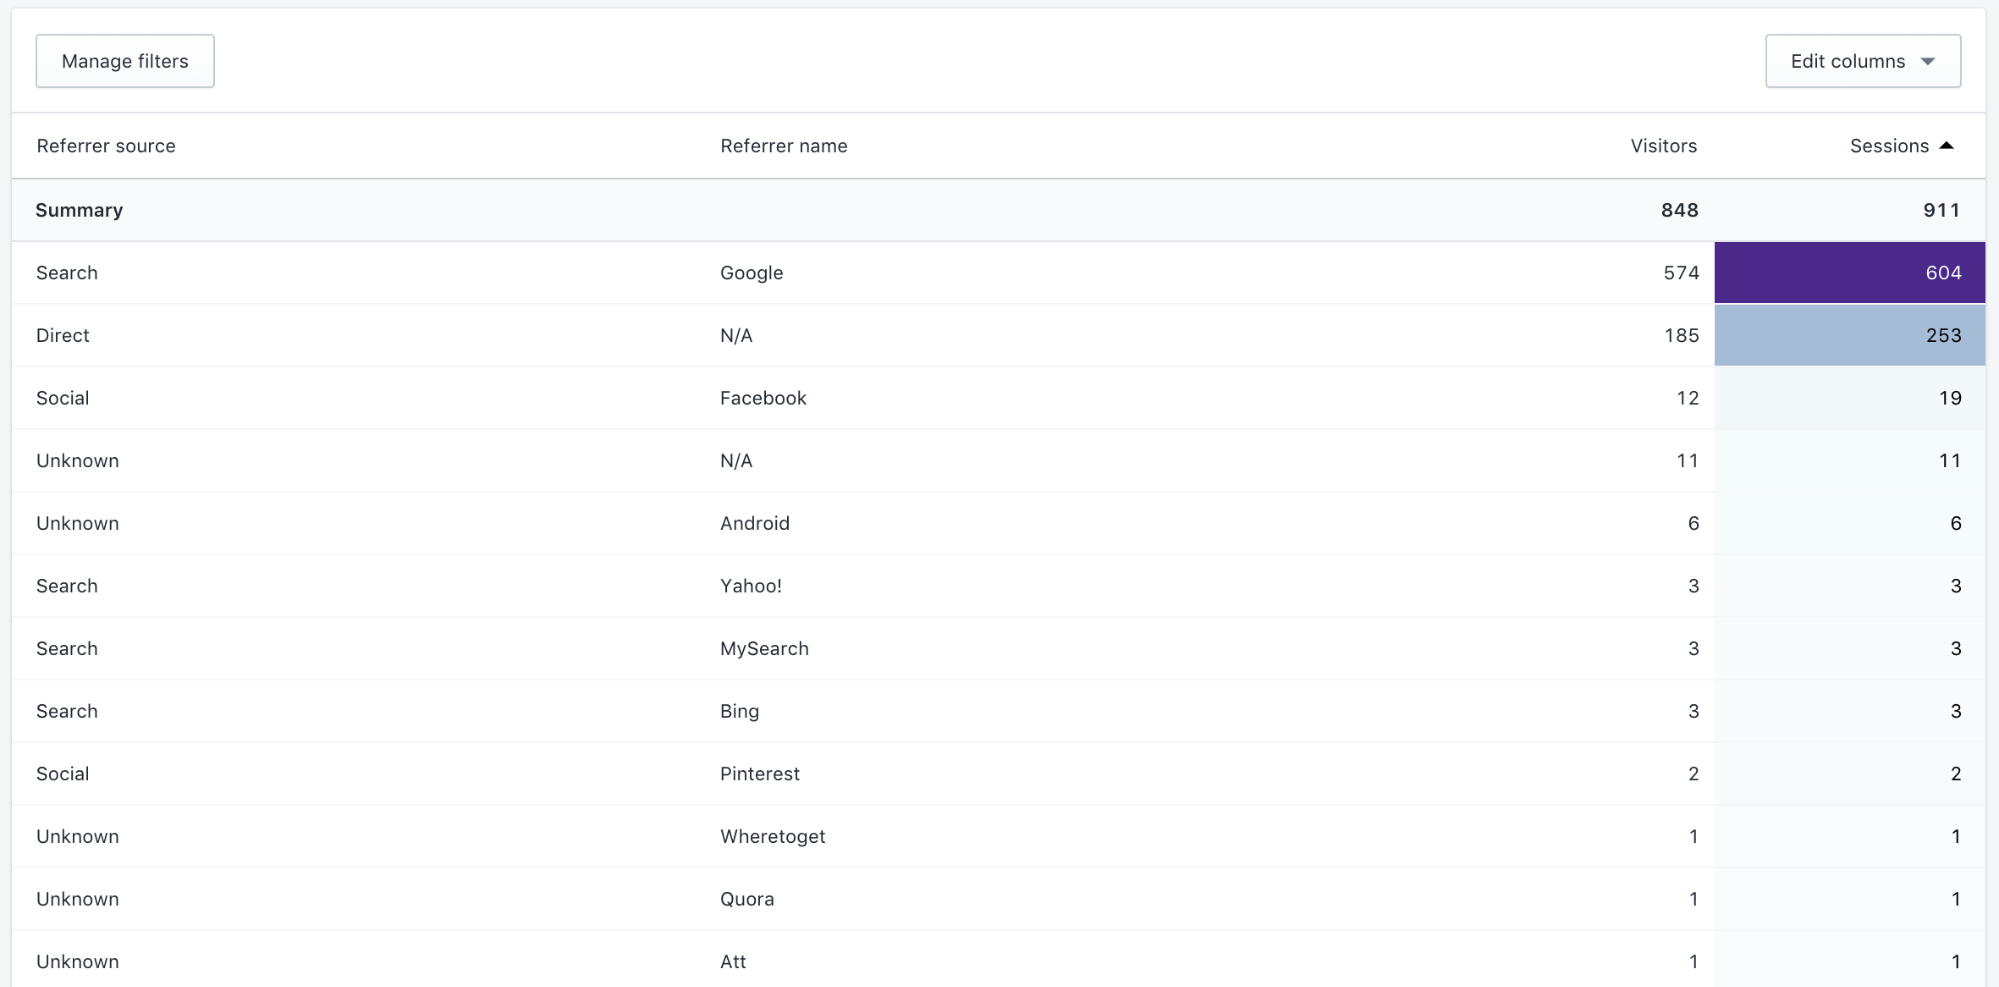
Visitors by Referrer
Visitors By Referrer shows you how your visitors got to your store.
(source)
In this case, Google Search is the top referrer source.
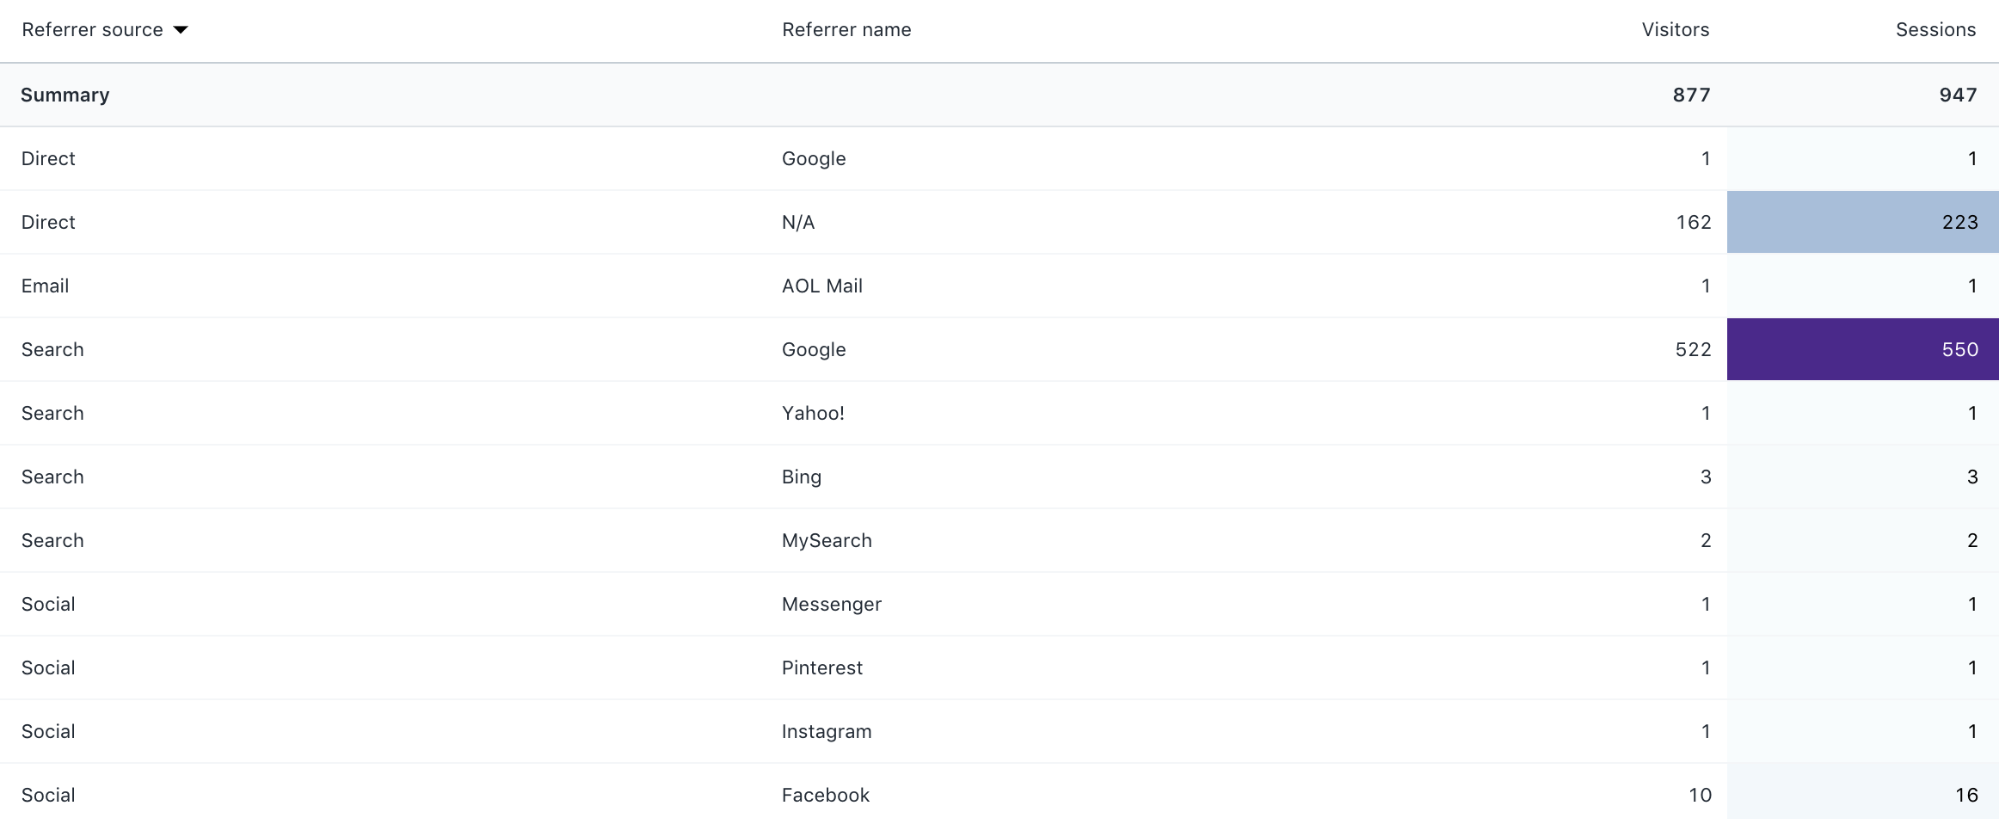
Keep in mind that you can modify the Date Range and Sort columns. Sorting by the Referrer source column, for example, makes it easier to see that Facebook is the top social media source.
(source)
Visitors by Location
Visitors by Location shows visitors and sessions by country.
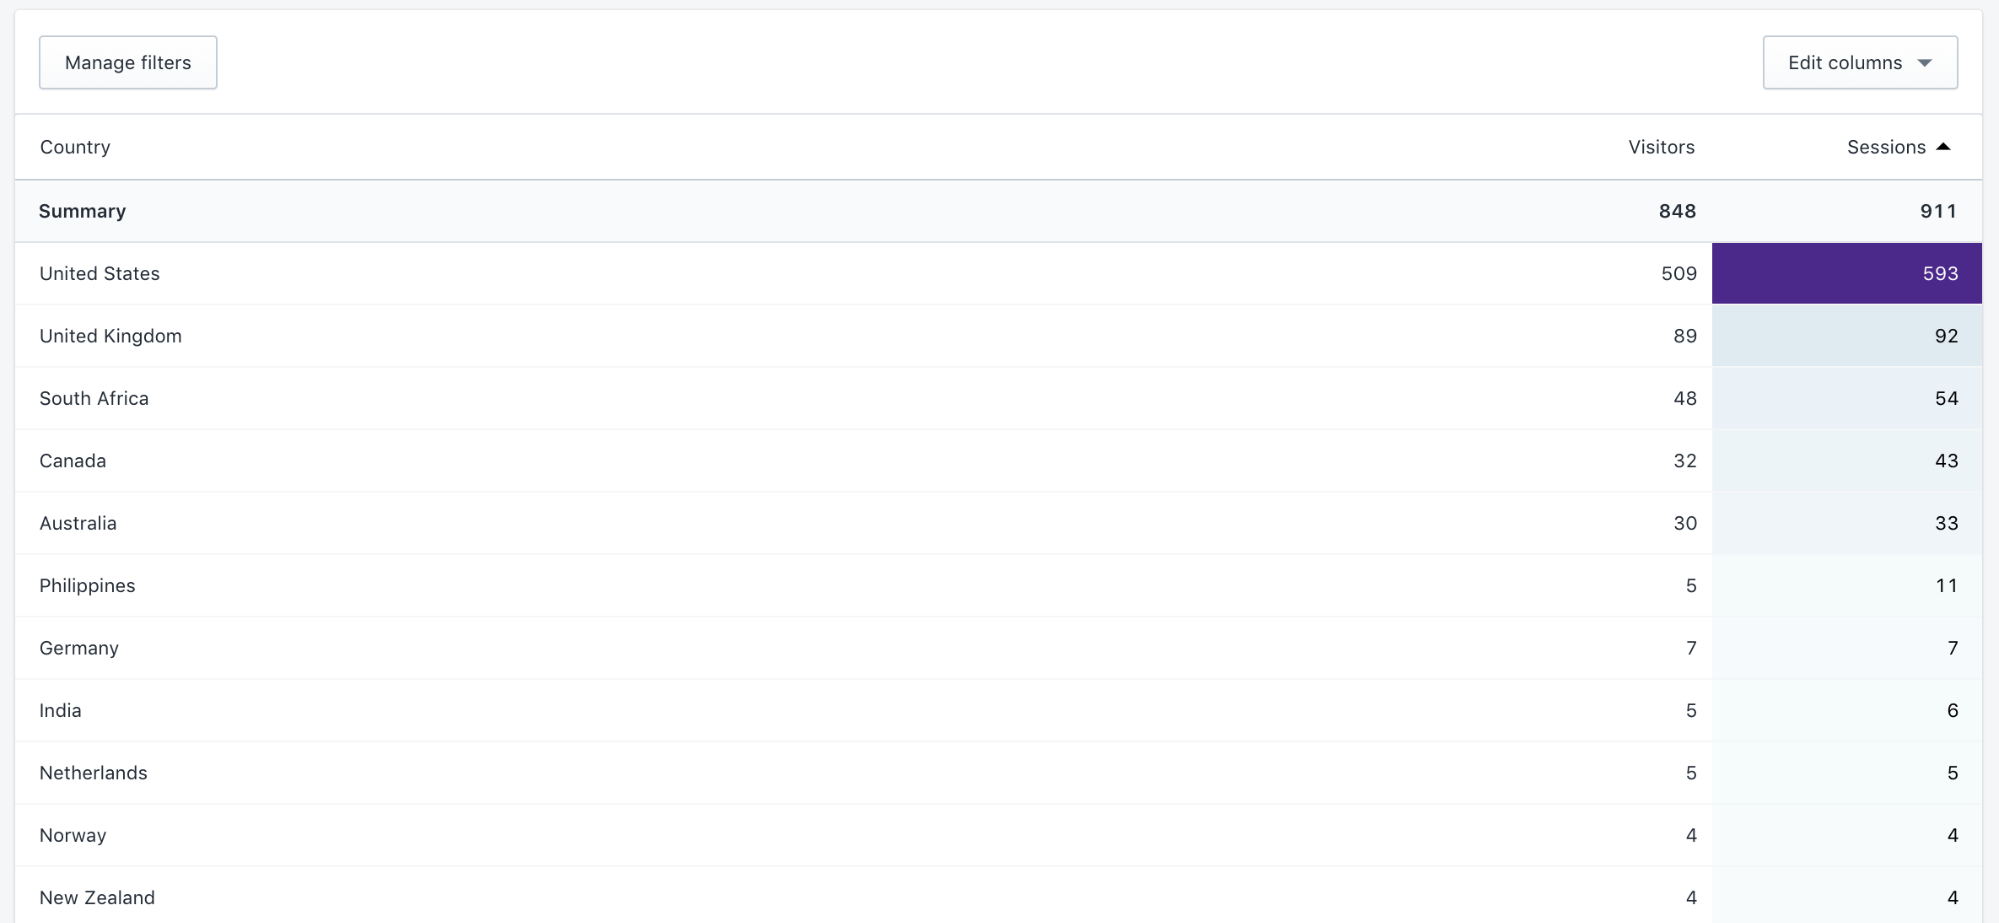
(source)
This data can be a hidden gem. You can use the information it uncovers to adjust your shipping rules, product pricing, and even site languages. It can also help inform which demographics you target with your advertising.
2. Behavior Reports
These reports focus on the actions that users take on your site. It can tell you a lot about your audience and your site’s user experience. You can find the following reports under Analytics > Reports > Behavior.
Top Online Store Searches
Top Online Store Searches shows you the search queries customers use to search your site. To use this report, your Shopify theme must have a search bar; otherwise, this report will be empty.
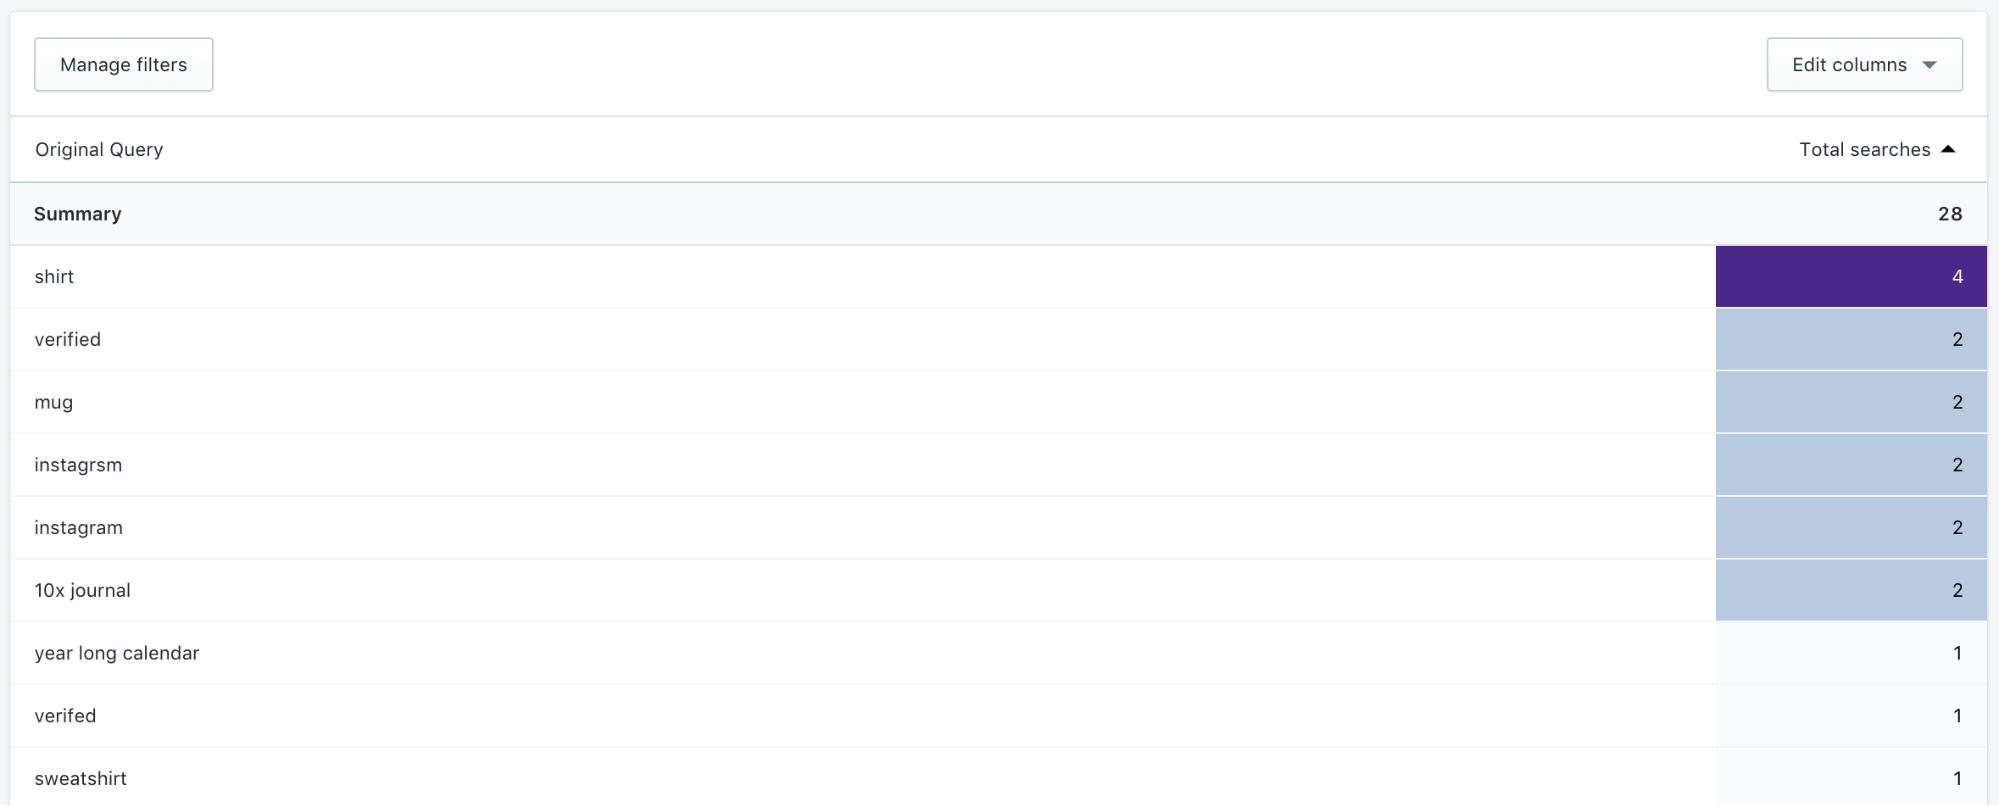
(source)
This report shows you the language your customers use to describe your products. Make sure the language you use in product names, descriptions, collections, and other copy mirrors the language your customers use.
Searches often correlate with popularity. You can see which items are gaining or losing popularity and adjust your marketing, featured products, and promotions accordingly.
An important point to keep in mind: Customers sometimes search for an item when they can’t find it through traditional navigation. While this isn’t always the case, it can give you a starting point for reviewing your navigation. Check out tools like UserTesting.com to explore any questions that arise about your user experience.
Visitors by Landing Page & Visitors by Device
The reports are exactly what they say. Visitors by Landing Page tells you where customers land when they visit your site. Visitors by Device tells you whether they were on a desktop, mobile device, or tablet.
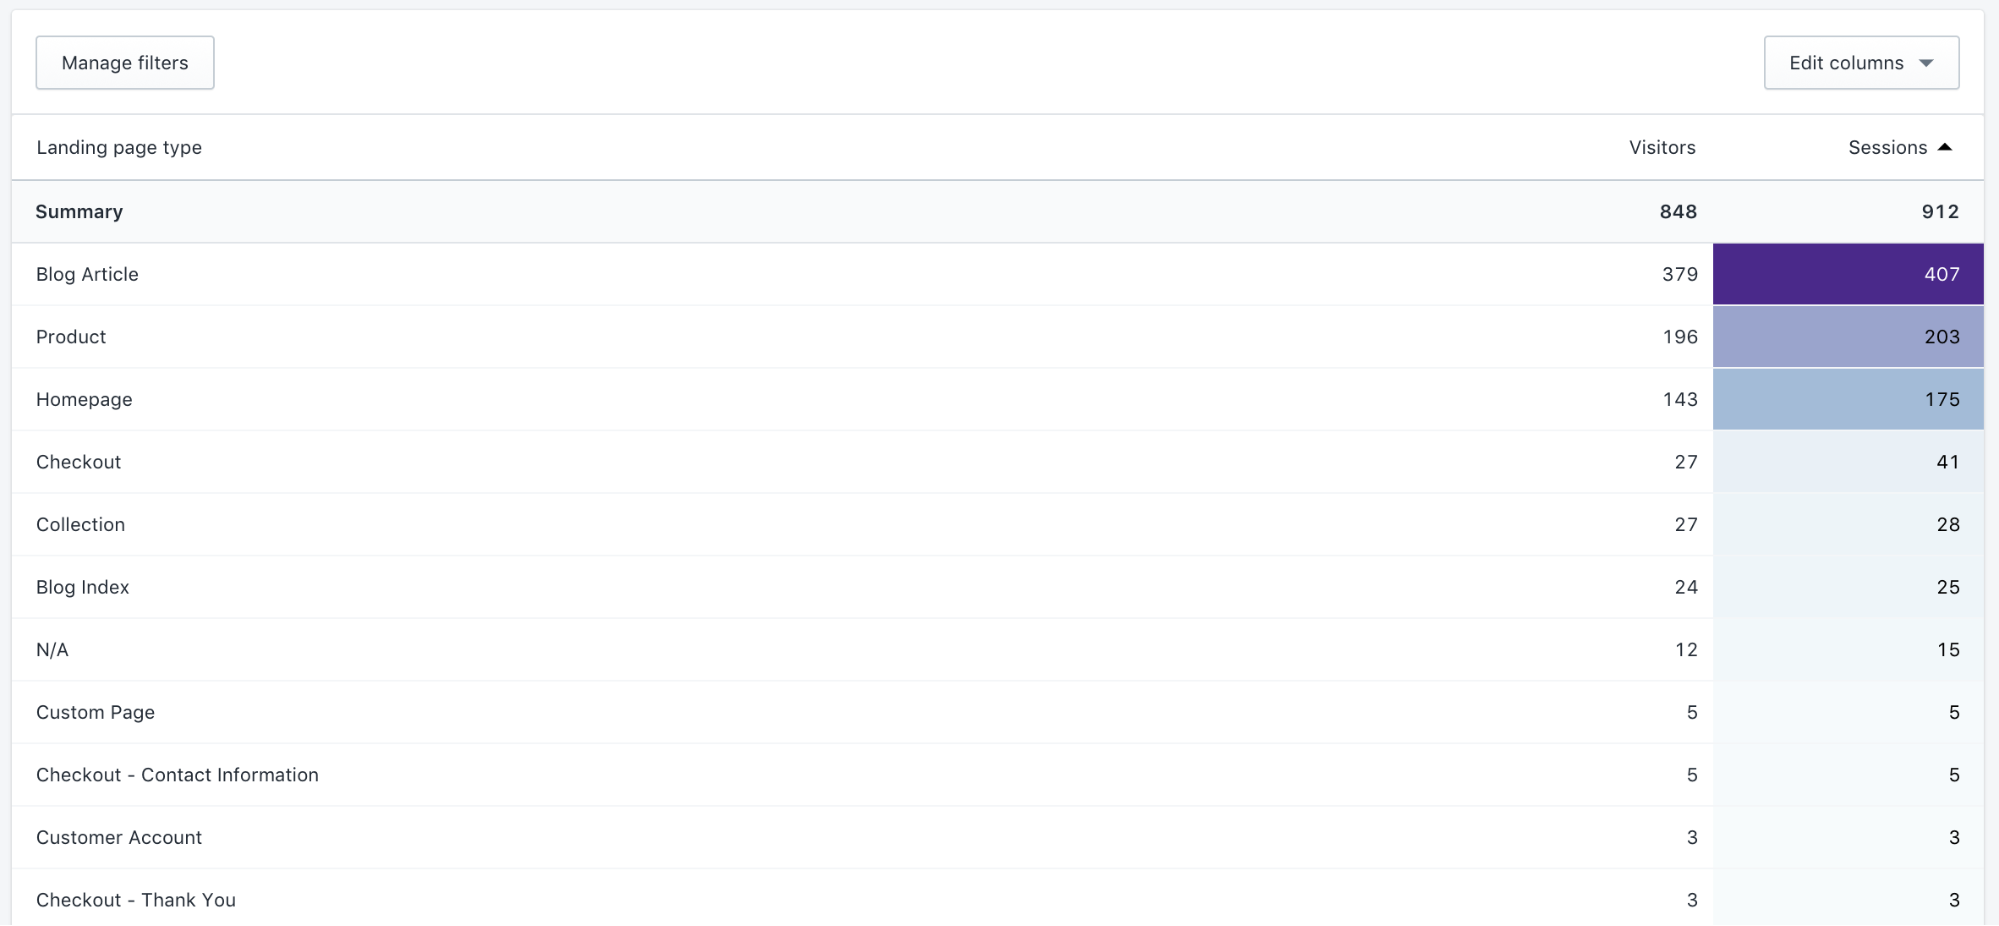
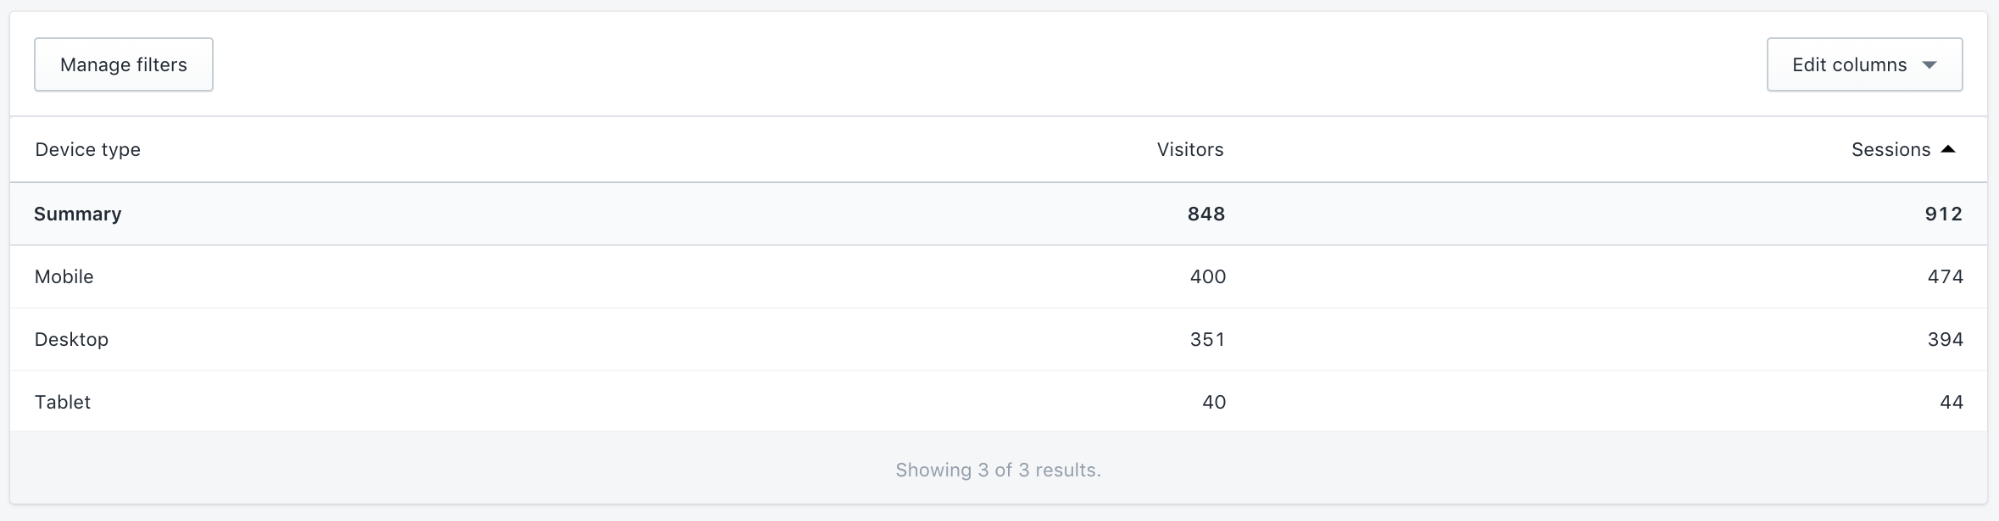
(source)
In this case, the reports show that the site’s blog is attracting attention, and that the site has a strong mobile audience. Two follow-up questions come to mind here: Is the site optimized for mobile devices? And can a user easily navigate to products from blog posts?
3. Marketing Reports
Marketing reports gauge the effectiveness of your marketing campaigns. You can find the following reports under Analytics > Reports > Marketing.
Visitors by Marketing Campaign & Sales by Marketing Campaign
These reports rely on the use of UTM (or Urchin Tracking Module) parameters. If you’re not using UTM parameters, this report will be empty.
UTM parameters are unique phrases appended to the URL to track marketing campaigns. Each URL includes a Campaign Source, Campaign Medium, and Campaign Name. So if you’re sending an email newsletter promoting a summer sale, your URL might look like this:
www.yoursite.com/?utm_source=newsletter&utm_medium=email&utm_campaign=summer_sale
Over time, you can check out your Visitors & Sales by Marketing Campaign reports to see which campaigns are the most successful.
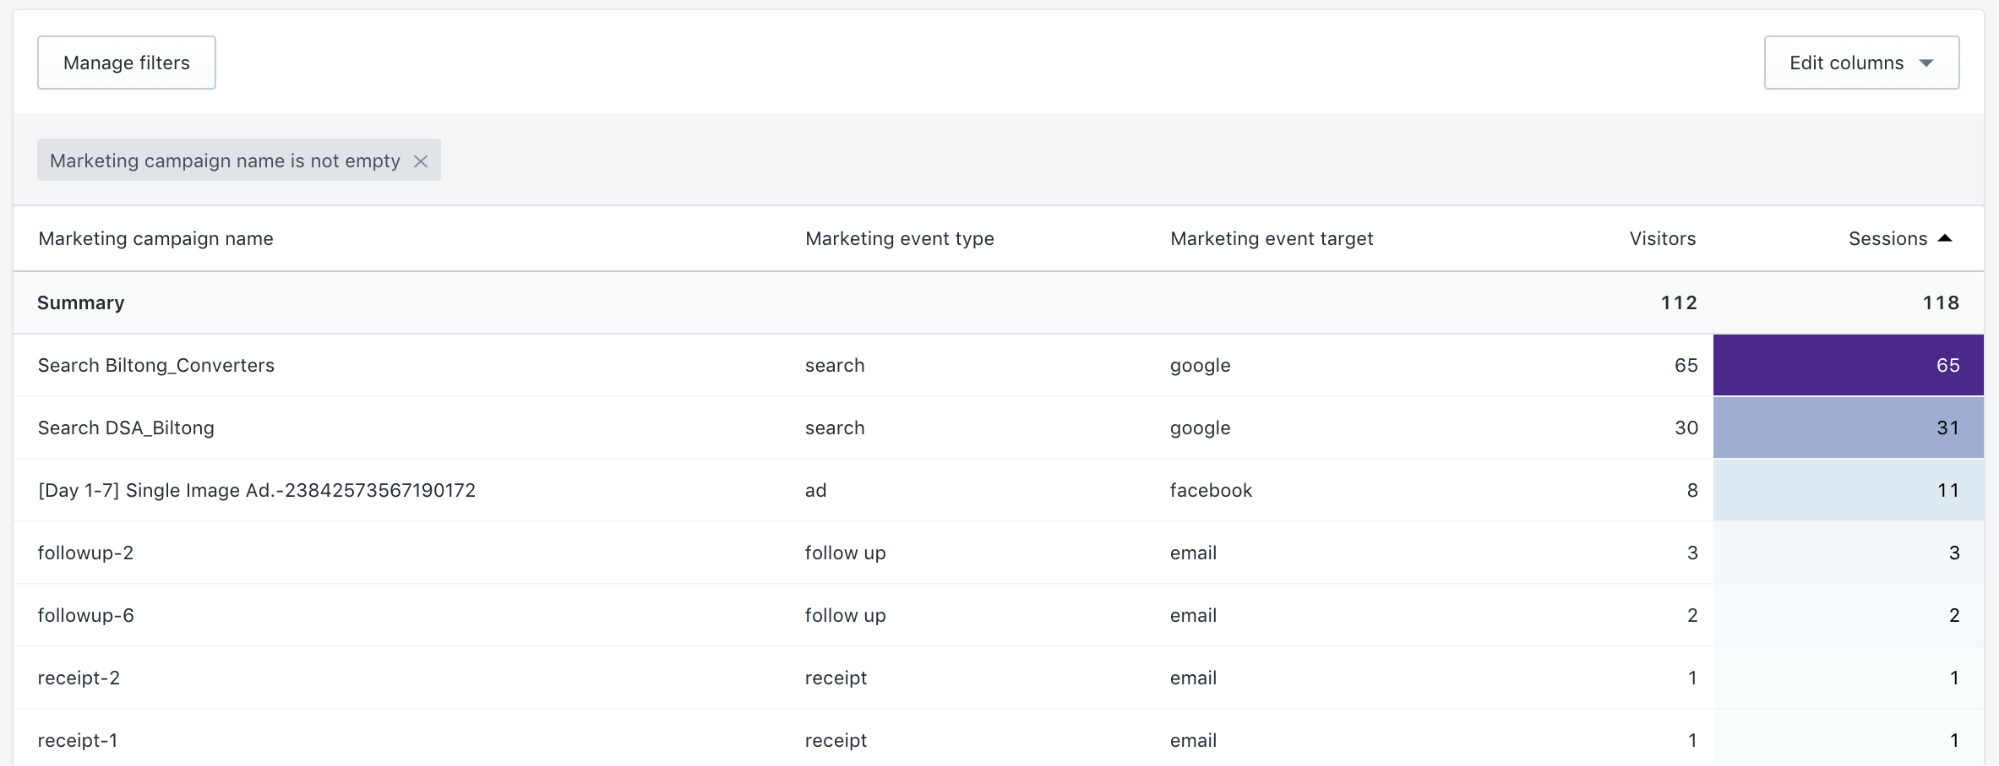
(source)
You can find more info on tracking campaigns with UTM here. To get started, you can use Google’s URL builder.
Filters and Columns
We’ve really only scratched the surface of what can be done in with Shopify Analytics. For each report we’ve explained, you can dig further into your data by using filters and modifying columns.
Filters
You may have noticed the Filter button in the top left corner of these reports. Filters let you segment your data into smaller chunks to uncover more specific trends.
Filters have three key components:
1. Name: identifies the filter, which will become a column in your report
Example: “Device type” or “City”
2. Operator: Defines the condition of your search
Example: “is” (meaning “equal to”) or “is not”
3. Values: Dictates the specific words or numbers your filter is based on
Example: “Mobile” or “New York”
So if you want to find your total sessions for mobile users, go to your Visits Over Time report. At the top left of your data table, click “Manage filters.” In the popup, select:
- Name: Device Type
- Operator: Is
- Values: Mobile
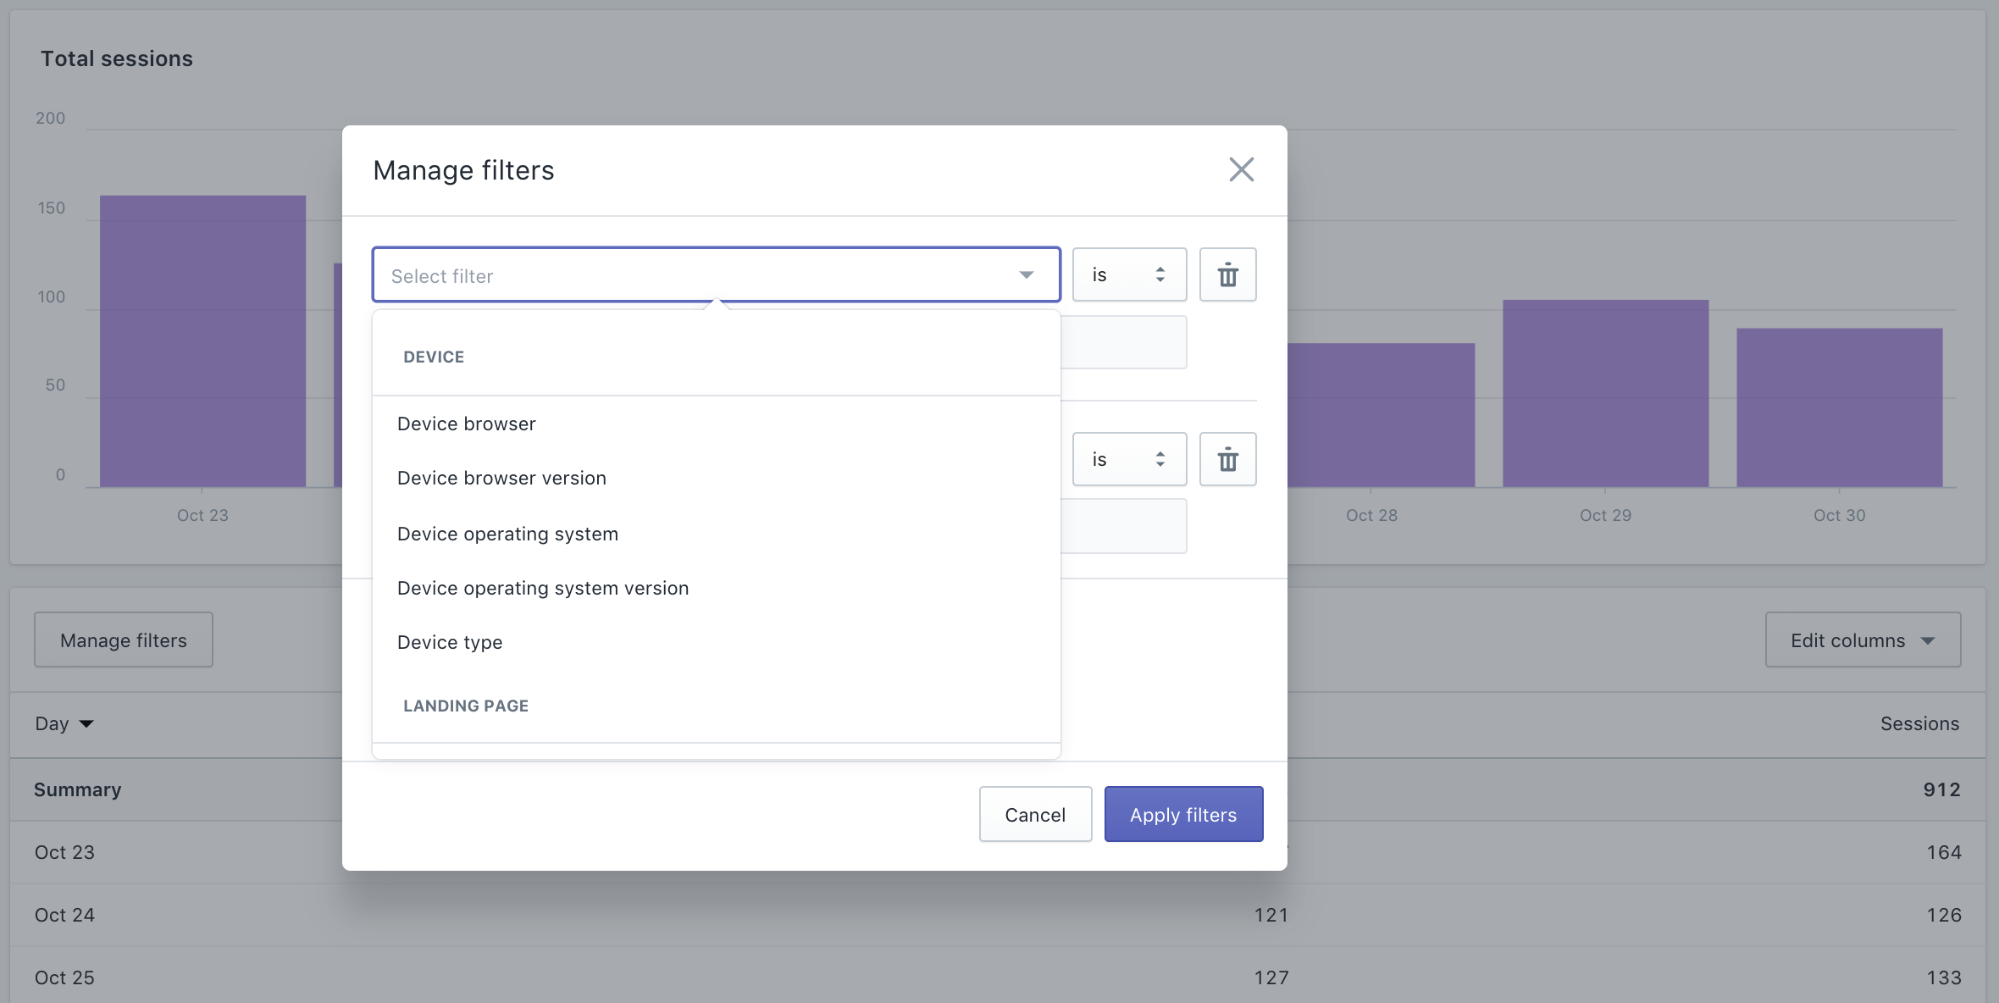
(source)
Filters are a powerful way to prove or disprove a theory. By customizing your reports with filters, you can inspect a specific subset of data and isolate important details. You have to use them to get comfortable with them, so don’t be shy. Dive in and see what you can discover.
Filter Example: Top Online Store Searches with No Results
This is perhaps one of the most overlooked and actionable reports. Go to your Top Online Store Searches, hit Manage Filters, and choose Returned Result is No. Then you can see what search terms resulted in the dreaded “Sorry, no results available” screen.
Why is this report so powerful? It can give you insight into product demand. If customers are searching for a product you don’t have, consider adding it to your inventory.
More importantly, it can show you when customers can’t find a product you do offer, due to a poor title or description.
For example, say you sell a knit hat like this.

(source)
But is that a knit cap, beanie, watch cap, skully, tuque, stocking cap, toboggan, ski cap, or a woolly? And is it a leopard, cheetah, or animal print? Each customer’s answer depends on their location and their personal preference.
You can tweak your products and their descriptions so that the most popular terms are found in search results. Or, depending on what search solution your site uses, you may be able to create search synonyms or control which products certain search terms pull up.
It’s important to review and address your No Results search terms regularly. Sort by the Total Searches column to prioritize your edits.
Columns
Each report has certain default columns, but you can add or remove columns to see more detail. Use the Edit Columns button at the top right of your table to add or remove data.
Here’s a Visitors by Location report showing which US cities (filter) have generated visitors, cart additions (column), and checkouts (column).
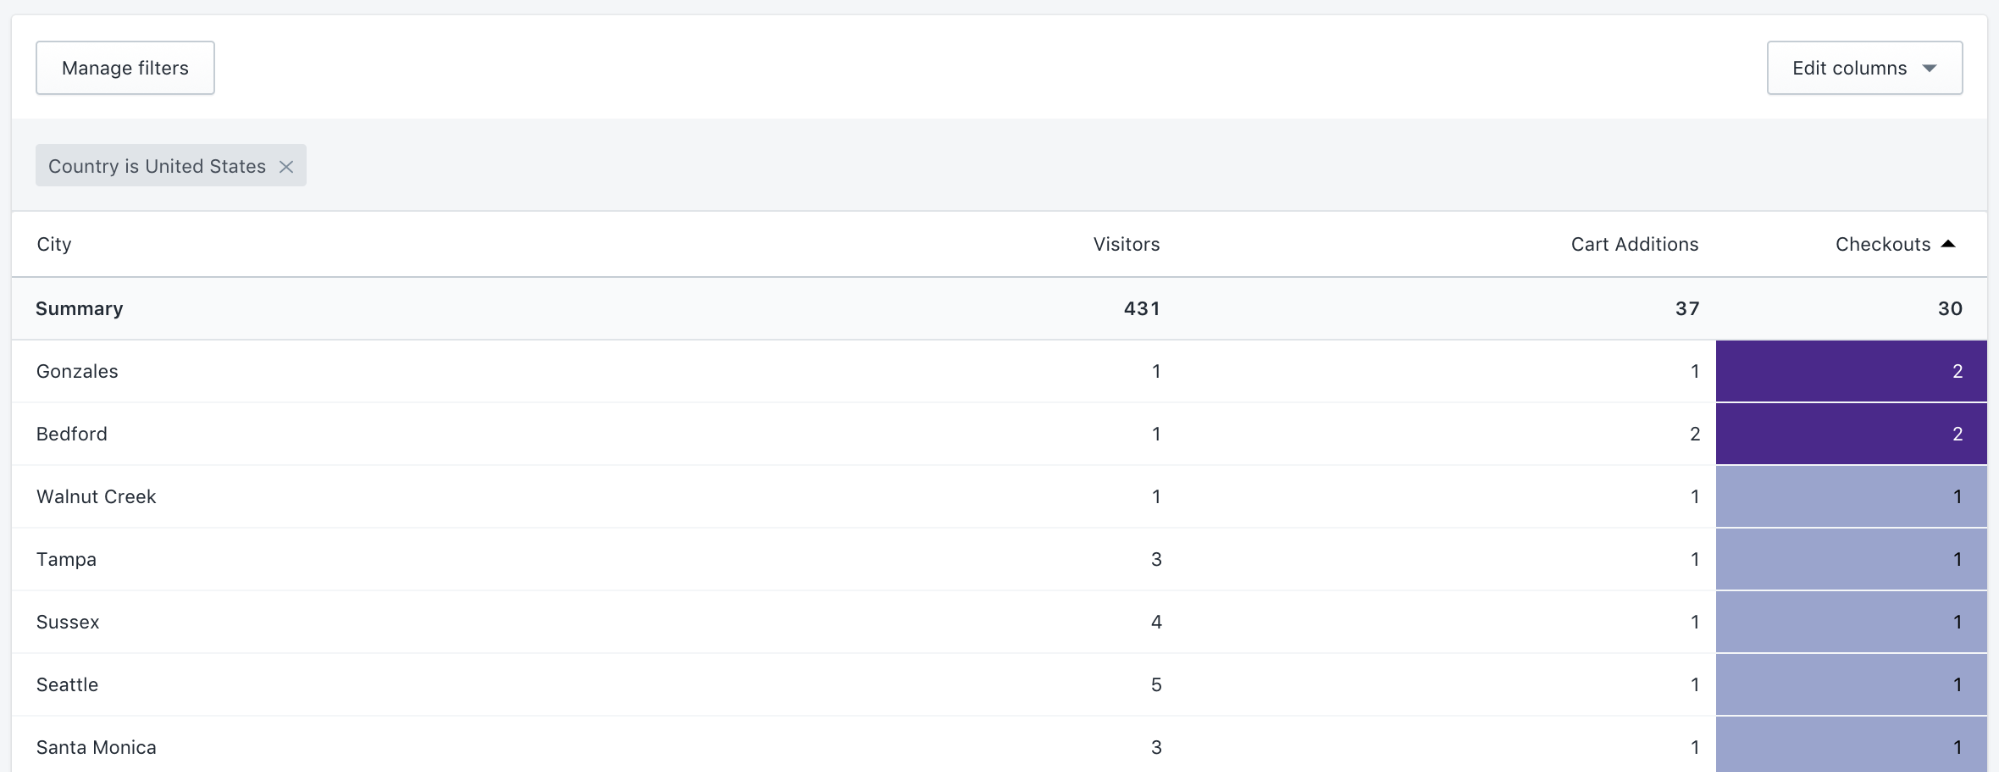
(source)
Wrap Up
Data and curiosity are both powerful tools for eCommerce entrepreneurs. Learn to ask questions, analyze your data, and be persistent in your hunt for answers. Take advantage of the prebuilt reports in Shopify, and use filters and columns to look beyond what’s visible on the surface. Happy analyzing!