


The average Shopify brand has a customer lifetime value (LTV) number it tracks, and it's usually wrong, often by enough to explain why the business feels like it's growing but never has the cash to show for it.
The formula isn't the problem. How it gets calculated is: revenue instead of profit, a blended average instead of cohorts, a third-party prediction treated as fact. Add those together, and LTV can land 50 to 60% higher than what a customer is actually worth, which is exactly what funds acquisition spend that doesn't hold up.
Here's where each error comes from, and the formula to replace it with.
The Formula Everyone Uses
The standard formula is: AOV = purchase frequency x customer lifespan.
Shopify's own documentation uses it. Most retention tools default to it. There is nothing wrong with it as a starting point. The issue is what version of that formula you are running and what you decide to do with the result.
Take a store with a $65 average order value (AOV), customers buying 3 times a year, active for 2.5 years. Revenue LTV = 487.50. Apply a real 45% gross margin (one that accounts for fulfillment, returns, and payment fees, not just product cost), and profit LTV drops to $219.38.
At $487.50, you can justify a $160 CAC and still hit a 3:1 ratio. At $219.38, your ceiling is $73. A brand running at $120 CAC looks fine under the first number and is losing money under the second. Same store, same customers, same acquisition spend. Different number, completely different verdict.
Revenue LTV is useful for forecasting top-line. It is not the number that should govern how much you spend to acquire a customer.

Revenue LTV vs Profit LTV
Where the Shopify LTV Calculation Actually Breaks
1. The Margin Problem
Revenue LTV ignores COGS, fulfillment costs, returns, and Shopify payment processing.
None of this shows up in the standard formula:
-
Payment processing: 2% + 25p (Basic) to 1.5% + 25p (Advanced) via Shopify Payments
-
Third-party gateway surcharge: 0.5% to 2% on top of that
-
Returns in apparel and health: typically 15 to 25% of revenue
We do a lot of retention audits, and quite often find that revenue LTV inflates actual profitability by 40 to 70%. A customer generating $300 in lifetime revenue at a 35% contribution margin is worth $105 in actual profit. If your CAC ceiling is set against $300, the error compounds quietly across every new cohort until you try to scale and the unit economics collapse.
The correct formula to use is: Profit LTV = AOV x purchase frequency x customer lifespan x gross margin %
That gross margin figure has to include all variable costs. If you have only entered product COGS in Shopify's profit reports, the number you have is still overstated.

Example of the Finances Summary dashboard in the Shopify admin
2. The Blending Problem
Divide total revenue by total customers to get a blended LTV. It takes 30 seconds and is nearly useless for acquisition decisions.
A customer from January 2023 has had over three years to build purchase history. A customer from January 2026 has had six months. Averaging them produces a number that represents neither. The 2023 customer inflates the average upward. The 2026 customer's actual retention behavior is invisible inside it.
We have seen this play out in audits. The blended LTV looks healthy, but a cohort table tells a different story: the last three or four acquisition cohorts, the ones that reflect what your current channels are actually delivering, are significantly weaker. The older cohorts are doing the work of making the business appear to retain customers.
The right approach is cohort LTV: group customers by first purchase month and measure each group independently over the same time window. That way, a January 2023 customer and a January 2026 customer are never in the same calculation.

3. The Survivor Bias Problem
Even when brands move to cohort LTV, many set their CAC ceilings off their oldest cohorts. It's the same mistake, just later in the process.
Old cohorts are survivors by definition, not a representative sample of your current acquisition base. Most found you before you ran performance marketing at scale, through word of mouth, organic search, or referral, when your category was less competitive. Their repeat purchase behavior reflects conditions that no longer exist.
When you use them to justify current CAC, you are applying data from your most loyal 5% to channels that are delivering a very different customer. Use the last 12 to 18 months of cohorts as the benchmark. That's who you're actually buying today.

What This Comparison Above Is Showing
A blended cohort number, the kind Shopify shows by default, mixes customers acquired in 2020 with those acquired last month. That mix can make retention look healthier than it actually is, because older cohorts have had years to accumulate spend that newer cohorts haven't had time to match yet.
The table below shows the full-history cohort data, all customers since the store's first sale, at Month 3. Filtering the same report to 2024-2026 acquisition cohorts only tells a different story, and shows whether the retention trend in the blended number is real or just an artifact of averaging in customers who found the store years ago.
| Metric | Full History |
|---|---|
| Cohorts included | 68 |
| Total gross sales | $544,384.74 |
| Total customers | 352 |
| Avg gross sales/cohort | $8,005.66 |
| Avg customers/cohort | 5.18 |
Filtering the same report to 2024-2026 cohorts only, the average Month 3 gross sales per cohort is $11,203, compared to $8,005.66 across the full history above. That's $3,197 higher, which looks like a clear win at first glance. But the customer count moves the other way: 4.26 returning customers per cohort at Month 3, versus 5.18 for full history. Fewer people are coming back
The extra revenue per cohort is coming from higher spend per returning customer, not from more customers coming back, and that's a different story than the top-line number suggests.
4. The Prediction Problem
Klaviyo calculates a predicted CLV for each customer profile: forecast revenue over the next 365 days, retrained weekly using your store's purchase history, order cadence, and engagement signals.
To activate it, your store needs:
- At least 500 customers with placed orders
- 180 days of order history
- Orders placed within the last 30 days
- Some customers with three or more orders
Predicted LTV is useful. It shows which customers are worth prioritizing in post-purchase flows, who is at churn risk, and who to route into a VIP segment.

Image taken from Klaviyo’s official guidelines on building a customer lifetime value (CLV) dashboard
The problem is that brands use it for acquisition budget decisions, and it is not built for that. Across the accounts we've audited, predicted LTV typically runs 30 to 50% higher than observed cohort LTV. The model extrapolates from early purchase behavior and assumes the retention curve holds. In practice, most of the revenue in a customer relationship arrives in the first 90 to 120 days. The long tail is much thinner than predictions project.
Observed cohort LTV sets acquisition budgets. Predicted LTV drives Klaviyo segmentation. Those are two separate jobs and the numbers are not interchangeable.
 How to Actually Run The Shopify LTV Formula
Setting the Right Gross Margin Figure
The starting point is getting the gross margin right. That means including product cost, fulfillment, average return costs, and payment processing fees in the number you feed into the formula. Not just product COGS. The full cost of delivering and getting paid for an order.
Once you have that, the formula is:
Profit LTV = AOV x annual purchase frequency x customer lifespan x gross margin %
Calculating LTV365
From there, move to cohort LTV rather than blended.
 On Shopify Advanced and Plus, go to Analytics > Reports > Customer cohort analysis.
The default view groups customers by first purchase month and shows repeat purchase rate across subsequent months. Switch the primary metric to "Amount spent per customer" to see revenue retention by cohort rather than just repeat purchase percentage. The projections toggle (requires 24 months of data) shows predicted future spend per cohort, but treats it as a directional signal rather than an input for acquisition budget decisions.
If you are on Basic or Grow, the cohort report is not available natively. Export customer order history from Analytics > Reports > Customers, identify first-time buyers by month, and track returns within 90 and 180 days manually in a spreadsheet. It is more work but it produces the observed data you actually need.
The metric to pull from all of this is LTV365: average revenue per customer across their first 365 days from acquisition. Every cohort has had the same window, so the comparison is clean. Across the accounts we benchmark, a healthy LTV365 shows 25 to 35% of first-time buyers returning within 90 days. Below 20% is a retention problem, and no amount of downstream tactic will fix it without addressing what is happening in those first 90 days.

Amount spent per customer by first-purchase cohort, with projections enabled
Breaking Down LTV by Channel
One additional layer that is easy to overlook: LTV by acquisition channel. Your store-wide LTV blends customers from Google Shopping, paid social, email, and organic into one number. Those groups behave differently.
A Google search-intent customer who already knows what they are looking for has a different purchase frequency and return behavior than a TikTok impulse buyer. Blending them hides which channels are producing profitable customers and which are producing one-time buyers who bring down the average.
Shopify's cohort report does not break down by acquisition source, even on the Plus plan. Getting channel-level cohort LTV requires exporting Shopify order data and merging it with UTM-tagged acquisition data, or using a tool like Lifetimely or Lebesgue that handles the join.

You can use apps like Lifetimely to help track LTV
Understanding ROI/Payback Period
The last piece is the return on your investment period.
LTV: CAC and CAC ROI are related, but they answer different questions. LTV:CAC tells you the efficiency of the customer relationship over its full window. Payback tells you how quickly you recover the acquisition cost in actual gross profit.
Two brands with identical 3:1 LTV:CAC ratios can look very different in practice. One recovers CAC in four months; the other in 14. The second is financing customer acquisition from working capital for over a year per cohort. At scale that becomes a cash flow problem even when the long-term economics look right.
Payback period (months) = CAC / (gross profit per order x monthly purchase frequency)
Under 6 months is healthy for a brand scaling on paid acquisition. Six to 12 months is acceptable if retention data supports it. Over 12 months requires either an unusually high LTV or outside capital to fund the gap.

What Shopify Gives You Natively
Here's what you can and can't get from Shopify without extra tools
|
Metric |
Available Natively |
Notes |
|
Average order value |
Yes, all plans |
Updated daily in the Analytics dashboard |
|
Purchase frequency |
Manual only |
Total orders / unique customers from your reports |
|
Customer cohort analysis |
Advanced and Plus only |
Repeat purchase rate and amount spent per customer |
|
Cohort projections |
Advanced and Plus only |
Requires 24 months of historical data |
|
LTV by acquisition channel |
No |
Third-party tool or manual data join required |
|
Profit LTV |
No |
Manual margin calculation required |
|
CAC |
No |
Manual calculation using ad spend data |
|
Payback period |
No |
Manual calculation |
Shopify shows you what customers did. It does not show you what they cost or what they were worth after margin. For stores on Basic or Grow, that means a cohort model built in a spreadsheet is the realistic starting point for getting LTV right.
For stores on Advanced or Plus, the native cohort report covers the retention picture well but still requires external data to get channel-level or profit-adjusted numbers.
Tools like Lifetimely, Lebesgue, and Triple Whale exist at different price points and handle different parts of that gap. The right one depends on where your biggest data blind spot is: margin visibility, channel attribution, or cohort analysis.

Customers section showing the report list from Shopify Analytics > Reports
The Number That Tells You Where the Problem Actually Is
AOV, purchase frequency, customer lifespan. Every LTV article covers these three levers. Most brands have already tested loyalty programs for frequency, upsell flows for AOV, and win-back campaigns to extend lifespan.
None of that matters until one number is right: second-purchase conversion rate within 90 days.
Below 25%, the problem isn't your loyalty program or your win-back sequence. It's what happened in the 90 days before those ever get triggered. Misaligned product expectations. Weak onboarding. A fulfillment issue. No contact after the order shipped. Pull this rate by cohort from the Shopify cohort report or a manual export. That single number tells you more about your LTV problem than any blended average or predicted CLV figure.
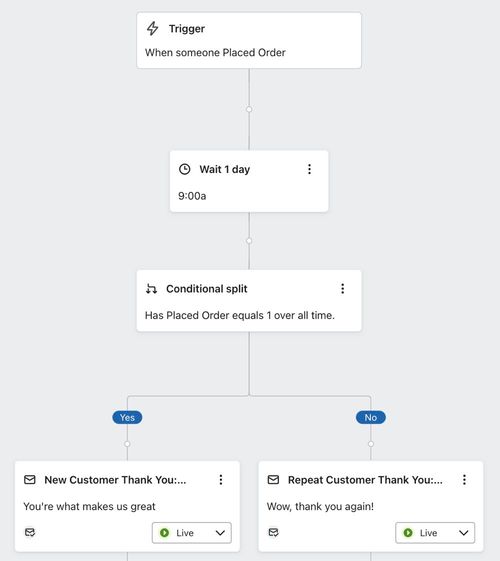
An example of a post-purchase flow in Klaviyo
The fix in Klaviyo is to stop running one generic post-purchase flow for every customer. Segment by first product category instead. Someone who bought a supplement starter kit needs a different next step than someone who bought a one-off gift item. Segmented flows consistently outperform generic ones, because they follow what the customer already told you about themselves with their first order.
Let's take an example with a fictional store. Numbers below are representative of a mid-size health and wellness brand on Shopify.
Inputs:
-
AOV: $68
-
Purchase frequency: 3.2 orders per year
-
Customer lifespan: 2.8 years
-
Gross margin on product COGS only: 62%
-
True gross margin after fulfillment, returns, payment fees: 44%
-
CAC: $58
How Most Brands Run It
|
Calculation |
Result |
|
Revenue LTV |
$68 x 3.2 x 2.8 = $609.28 |
|
Profit LTV (COGS margin only) |
$609.28 x 0.62 = $377.75 |
|
LTV:CAC |
$377.75 / $58 = 6.5:1 |
|
Payback period |
$58 / ($68 x 0.62 x 3.2 / 12) = 5.2 months |
Looks strong. That is the number that goes in the deck.
What the Numbers Actually Are
|
Calculation |
Result |
|
Profit LTV (true margin) |
$68 x 3.2 x 2.8 x 0.44 = $268.08 |
|
LTV:CAC |
$268.08 / $58 = 4.6:1 |
|
Payback period |
$58 / ($68 x 0.44 x 3.2 / 12) = 7.3 months |
Still healthy. But now apply the cohort correction. This store's observed LTV365 for 2025-2026 acquisition cohorts is $142. Not the $217 that dividing revenue LTV by average lifespan would imply. Recent cohorts are weaker. The older ones have been pushing up the lifespan estimate for years.
|
Calculation |
Result |
|
Profit LTV365 (recent cohorts, true margin) |
$142 x 0.44 = $62.48 |
|
LTV: CAC (observed, recent cohorts) |
$62.48 / $58 = 1.08:1 |
At 1.08:1, the brand is acquiring customers at break-even for year one. That is not a terminal problem on its own. But this brand was running paid acquisition at budgets justified by a 6.5:1 ratio. The gap between those two numbers is where the cash went.

Work With Shero on Your Retention Strategy
If you want to know what your real profit LTV looks like by acquisition channel and where your second-purchase rate is breaking down, our retention marketing audit gives you a clear picture of both.
We also work with Shopify merchants to build the marketing automation infrastructure that turns first-time buyers into repeat customers.
Book a free consultation with our expert first.

