


Repeat purchase rate tells you how many customers came back, not what they spent. Spend is what decides whether your media budget is buying growth or replacing what you lost, and what you sell sets the ceiling.
Here's how to calculate NRR for a DTC brand, pull it from Shopify, and judge the result against your category.
If you are still building the program itself, start with our guide to building a subscription program on Shopify and come back when the billing data is real.
There are two ways to calculate NRR
The right one depends on how you sell, whether it’s subscription based, or based on one-of sales. The table of contents in the article will help you jump to where it most suits you.

If you sell both, follow both rows, then use the subscription filter in the Shopify report to separate the two groups.
The NRR formula
NRR takes a fixed group of customers, looks at what they paid you at the start of a period, and compares it against what the same group paid you at the end.
NRR = (starting recurring revenue + expansion + resumed - contraction - churn) ÷ starting recurring revenue
New customers acquired during the period stay out of both sides, so what you end up with is a read on the existing base with acquisition stripped out of it.
Five components feed it:
|
Component |
What it is in a DTC store |
|
Starting revenue |
What the cohort billed in the first period |
|
Expansion |
Larger size, added SKU, higher quantity, shorter cadence, price increase |
|
Resumed |
A paused subscriber who restarted inside the measurement window |
|
Contraction |
Smaller size, removed SKU, longer cadence, discount applied |
|
Churn |
Cancellations plus payment failures that never recovered |
Separate resumed revenue from winback before you start, because the two look identical in a dashboard and belong in different places.
|
Subscriber |
Did they leave the cohort? |
Where the revenue counts |
|
Paused, then restarted |
No |
Resumed, inside NRR |
|
Canceled, then came back later |
Yes |
Acquisition, outside NRR |

A pause never leaves the cohort. A cancellation does, which is why a winback is acquisition rather than retention.
Gross revenue retention runs the same math without expansion or resumed revenue, which means it cannot exceed 100%.
GRR = (starting recurring revenue - contraction - churn) ÷ starting recurring revenue
You want both numbers in front of you, because a wide gap between them tells you expansion from a small group is covering losses across a large one, and the number will fall the month expansion stalls.
Expansion is capped by what your customer consumes
Software expands on its own as usage grows. In the Aleph and Benchmarkit data, usage-based companies post a 108% median NRR against 98% for seat-based. Physical products have a harder stop, since nobody consumes faster because you sent a campaign
Expansion needs the customer to add a different product, which depends on whether your catalog holds one that fits the routine they already have, and the amount of room above the first order varies enormously from one category to the next.
|
Category |
Typical cadence |
Where expansion comes from |
Headroom |
|
Supplements and vitamins |
30 days, one bottle |
Additional products in the same daily stack |
High |
|
Skincare |
6 to 12 weeks per SKU |
The routine grows: cleanser, then serum, then SPF |
High |
|
Meal kits and prepared food |
Weekly |
More servings and more meals per week |
High |
|
Household essentials |
4 to 6 weeks |
Adjacent SKUs and larger refill sizes |
Moderate |
|
Coffee and tea |
2 to 3 weeks |
Grade, single origin, equipment. Rarely volume |
Low |
|
Pet food |
Set by animal weight and bag size |
Treats and supplements, never the food itself |
Low |
|
Curated boxes |
Monthly |
Box size or tier, rarely a second SKU |
Low |
Expansion headroom by category. Consumption sets the limit before your program does.
Cadences for coffee, household essentials and supplements come from our client work and match the patterns in our subscription program guide. The headroom column is our read on the consumption mechanics, and not survey data.
 An example from of our clients 'Valentine Coffee Co.'
Two brands both reporting 85% can be in opposite positions.
A pet food brand at 85% has close to nowhere left to go, whereas a supplement brand at the same number is leaving expansion revenue uncollected, because a customer on a daily multivitamin has room for three more products and nobody has offered them.
Run this check before you set a target:
-
Take one real subscriber.
-
Count how many of your SKUs could join their order without them changing a single habit.
-
That number is your expansion headroom. If it comes out at zero or one, stop planning upsell campaigns and put the whole effort into keeping the subscribers you already have.
Decide these things before you calculate
Two people at the same brand can calculate NRR for the same month and land ten points apart with no arithmetic error between them. The choices below cause it.
1. What the cohort is.
Either of these works, as long as you keep it.
-
Every subscriber active on the first of the month. The simplest version to build.
-
An acquisition cohort, meaning everyone who first subscribed in a given month. More useful, because you can read March's cohort against September's and see whether the program is improving.
Whichever you pick, customers stay in the denominator after they leave.
Snowflake, the data platform, counts a customer who stopped using the platform at zero instead of removing them from the base, which is what its 10-Q definition describes. We see plenty of DTC calculations drop churned customers, which inflates the result and makes the trend meaningless.
2. What counts as recurring revenue.
A store running monthly, six-week, quarterly and prepaid plans at once has no natural monthly number. There are two ways out of that, and both are fine:
-
Normalize everything to a monthly value, plan price divided by billing interval.
-
Move to an annual window, where the cadences stop mattering.
Adding up whatever happened to bill in a calendar month gives you a number that swings on the calendar instead of on customer behavior.
3. How you treat pause and skip.
This one gets its own section below, because on a subscription store it moves the number further than the other three.
4. Whether returns come out.
A refunded order is revenue you gave back, and leaving refunds in overstates every figure in the calculation, badly so in categories where returns run high. Findwhat else belongs in that number, to be able work from net sales instead of gross.
Write these five down in the same document as the number, in something close to this form:
|
Definition |
Your choice |
Set on |
|
Cohort basis |
Active on the 1st, or acquisition month |
|
|
Recurring revenue |
Normalized monthly, or annual window |
|
|
Pause and skip |
Held at contract value, or counted as churn |
|
|
Refunds |
Net sales, or gross |
|
|
Measurement window |
Monthly, trailing three-month, or annual |
When NRR moves eight points next quarter, the first question is whether the business changed or the definition did. Copy this table into your own doc and date each row as you settle it
A 3,000-subscriber program example
Let's take the example of a supplements brand, since that category has real expansion headroom and the math shows more.
The store starts January with a fixed cohort of 3,060 subscribers on a 30-day cycle at a $50 average bill.Of those, 3,000 bill in January, which is the $150,000 of starting recurring revenue, and 60 are paused and bill nothing, which is where the resumed line comes from when they restart.
|
Component |
Amount |
Share of start |
|
Starting recurring revenue |
$150,000 |
|
|
Expansion (a second product added to the stack) |
+$6,000 |
4.0% |
|
Resumed (paused subscribers restarting) |
+$3,000 |
2.0% |
|
Contraction (dropped a SKU, moved to 60 days) |
-$4,500 |
3.0% |
|
Churn (cancels and failed payments) |
-$18,000 |
12.0% |
|
Ending revenue from the same cohort |
$136,500 |
What these numbers tell you:
- NRR 91%, GRR 85%. The six-point gap is expansion and resumed revenue covering 40% of the losses. If expansion shrinks toward zero, nothing cushions churn.
-
Both are monthly. Held for twelve months, 91% compounds to about 32%, so never set it beside an annual benchmark like the 102% SaaS median.
Turn the gap into a budget number
A percentage tells nobody what to do, so convert it into the monthly bill it creates. Every point below 100% is revenue you have to replace with new subscribers before you grow at all.
Same store, same $50 average bill, at a $65 acquisition cost:
| NRR | Revenue to replace each month | New subscribers needed | Annual media cost |
|---|---|---|---|
| 87% | $19,500 | 390 | $304,200 |
| 91% | $13,500 | 270 | $210,600 |
| 95% | $7,500 | 150 | $117,000 |

What each NRR level costs in acquisition spend each year, just to stay flat.
Moving from 91% to 95% saves that store $93,600 a year in media that was buying no growth, which is the row to put in front of a founder asking for more prospecting budget.
Pause and skip can cost you five points
A paused or skipped subscriber bills nothing that month, so under strict monthly accounting they show up as lost revenue, indistinguishable from a cancellation, even though they have not gone anywhere.
Recurly's 2026 State of Subscriptions found 38% of consumers would rather pause than cancel, and at brands that offered a pause option, three in four of the subscribers who paused came back within months.
Stay with the same 3,000-subscriber cohort. Say 200 of them skipped or paused in January rather than canceling, and all of them resumed by March. The churn line of $18,000 now contains $10,000 of revenue the store never lost.
|
Read |
Starting revenue |
Ending revenue |
NRR |
|
Monthly, pause counted as lost |
$150,000 |
$136,500 |
91.0% |
|
Pause held at contract value |
$153,000 |
$146,500 |
95.8% |
Hold pauses at contract value and you have to do it at both ends. The 60 subscribers already paused in January join the starting figure at $50 each, which takes the denominator to $153,000. Adjust only the ending side and you will overstate the gap.

The same month read two ways. The only difference is how paused subscribers are counted.
This creates an awkward problem for anyone doing the work properly, because every flexibility improvement makes the reported number worse.
Move pause to the first screen of the portal and pause usage climbs, so monthly NRR drops while real retention improves. We have watched brands roll that work back after one bad month of reporting.
Apply both of these:
-
Measure on a trailing three-month or annual window. Pause and resume net out inside the period, so the noise disappears without you adjusting anything by hand.
-
Report a pause-adjusted figure beside the strict one. Hold paused subscribers at contract value, label the line clearly, and never present it on its own.
A skip defers one order on an active subscription and a pause holds an active subscription with no scheduled charge, so neither one is churn. If your platform files them that way, change the setting.
Calculate NRR without a subscription program
Plenty of Shopify stores have no recurring billing at all, and most published guides stop there, but the metric still works if you swap the billing cycle for an anniversary window. What you are measuring here is cohort revenue retention rather than contractual NRR, so say so when you report it.
Take every customer whose first order fell in year one and sum their net sales in that year, then sum the same people's net sales in year two. Customers who never came back stay in the denominator and contribute zero, the same way a contractual NRR calculation does.
A 2023 cohort of 5,000 customers:
|
Period |
Net sales from the cohort |
Per original cohort member |
|
2023 (year one) |
$520,000 |
$104 |
|
2024 (year two) |
$198,000 |
$39.60 |
|
2025 (year three) |
$173,000 |
$34.60 |

The acquisition order sits in the first bar only, which is why the first ratio reads so low.
Year one to year two gives $198,000 ÷ $520,000, or 38%.
38% looks alarming, but the method is what produces it.
Every customer in that cohort bought in year one, because buying is what put them there, and only the repeat buyers show up in year two. The acquisition order lands in the denominator and never in the numerator, which holds the ratio well below 100% however good your retention is.
Compare year two against year three instead, and the acquisition order sits outside both sides of the calculation. That gives $173,000 ÷ $198,000, or 87%.
That version moves, compares across cohorts, and can climb past 100% when a cohort's spend grows. Record the 38% as well, since it tells you how much of the first order you win back in year two, though no finance team would accept it as a retention figure.
One warning before you run it.
A discounted first order shrinks the year-one denominator, which flatters the ratio, while the customers a deep discount brings in tend to retain worse, which pushes it the other way. The two effects do not cancel cleanly, so split your cohorts by acquisition offer before you decide the product is the problem.
Build the report in Shopify
Go to Analytics > Reports, filter Category by Customers, open Customer cohort analysis.
Access to the report has changed across plans more than once, so check what your own admin shows before you build reporting on top of it. If the report is not there, export your order data and build the cohort table in a sheet.

Where the cohort report lives in the Shopify admin.

The default view counts customers, which cannot produce a revenue retention number.
Then change four things in the configuration panel:
1. Metric.
The default shows customer counts, so switch it to net sales. The Metric menu also carries gross sales, customer retention rate, average order value and amount spent per customer. Pick net sales, because it already has refunds and discounts taken out.

One setting turns a customer-count report into a revenue retention report.
2. Intervals.
Move from monthly to quarterly for the anniversary method, since monthly is too noisy to read on a non-subscription store.

Quarterly intervals on a non-subscription store. Monthly moves too much to read.
3. Cohort definition.
Filter on first order if you want to split the analysis. The available filters are sales channel, marketing channel, marketing type, product name and subscription, and that last one splits customers who started on a subscription from those who did not.
On a hybrid store, run it both ways and compare.

The subscription filter separates subscribers from one-time buyers in the same store.
4. Comparison.
Set it to compare between cohorts, so you read an older cohort against a newer one instead of alone.

Comparing cohorts against each other rather than reading one on its own.
Each row covers one cohort by first-order month. The grid then gives the cohort's first orders their own column, separate from period 0, which holds only the repeat orders those same customers placed in that first period.

Divide the later boxed cell by the earlier one. The first-orders column stays out of the calculation.
The reading is the same one from the section above:
-
Take the row for one cohort.
-
Leave the first-orders column out of the calculation. That is the acquisition order, and it belongs on neither side of a retention ratio.
-
Divide a later period column by an earlier one, four quarters apart. Avoid period 0 as your starting column: it only holds repeat orders from what was left of the first period, so it reads low and inflates the ratio.
Watch for two things before you trust the output.
Shopify's own documentation states that customer reports are based on the entire order history of the new customers in the report, not only the orders placed inside your selected timeframe. Cohort membership holds up fine, but be careful reading revenue figures across a narrow window.
The projections toggle only works on the amount spent per customer metric, needs 24 months of history, and is built from your store's data alone, so treat it as a trend line and not a forecast you plan against.
Pull the data from Recharge, Loop or Skio

Recharge, Loop, Skio, Stay AI and Ordergroove all report active subscriber counts, cancellations and failed payments separately, and none of them ships an NRR figure you can use without checking its definitions first.
Export monthly and confirm three things before you calculate anything:
-
When the platform marks a subscription churned. On the first failed charge, or after the retry sequence ends. That choice alone moves NRR by several points on a store with meaningful payment failure.
-
How pauses are counted. Active, churned, or a separate state.
-
Whether the revenue figures are net of refunds. Usually not.
Export your definitions along with your numbers. In the platform migrations we have run, historical subscription data does not come across, so your baseline resets the day you switch and your written method is the only part that survives.
What is a good NRR for a DTC brand?
Start with your category instead of a number off a chart. Expansion headroom sets the range you can reach, and the table earlier in this guide gets you closer than any published figure will.
No NRR benchmark built on a real DTC dataset exists. What gets published comes from software or from one firm's client experience.
|
Source |
Population |
NRR |
|
230 companies reporting the metric, FY2025 |
102% median |
|
|
One usage-based public company |
126% |
|
|
One CFO firm's DTC portfolio |
75% to 95% described as realistic |
Read that table with three things in mind:
-
The first two rows come from a survey and an SEC filing, and both measure software.
-
The third comes from one CFO firm's experience with its own DTC clients, published without a dataset behind it. Use it as a sanity check. Do not set a target against it, and never let a person be measured on it.
-
None of the three separates a pet food brand from a skincare brand.
Benchmark against yourself instead. These four comparisons work:
-
The same cohort, quarter on quarter. Check whether the curve is flattening or still falling.
-
Newer cohorts against older ones at the same age. Compare month 12 to month 12, never month 12 to month 3.
-
Your best-selling SKU's subscribers against the rest. In a category with real headroom, the customers who started on your hero product should expand faster than everyone else, and if they do not, the cross-sell is the problem instead of the churn.
-
Subscribers against non-subscribers in the same store. Across 20,000 brands, Recharge found subscribers placed nearly 3x more orders than one-time shoppers, so measure your own gap and see whether the program covers its app fee and the work it takes to run.
How to move the number
NRR moves two ways, and different teams own each one.
Expansion, which raises the top of the calculation. Check your headroom first, because in a low-headroom category these four will move very little and the effort belongs on the other half.
-
Prepaid plans. Six months billed once is six months of revenue booked with a single point of payment failure. Prepaid raises upfront cash and complicates the billing logic, so price it deliberately.
-
A second SKU instead of a bigger box. Cross-sell inside the existing plan expands the bill without changing what the customer already decided they want.
-
Price increases on the existing base. The fastest expansion lever available, and it shows up in contraction and churn one to two billing cycles later, so measure the net across two quarters instead of the month it lands.
-
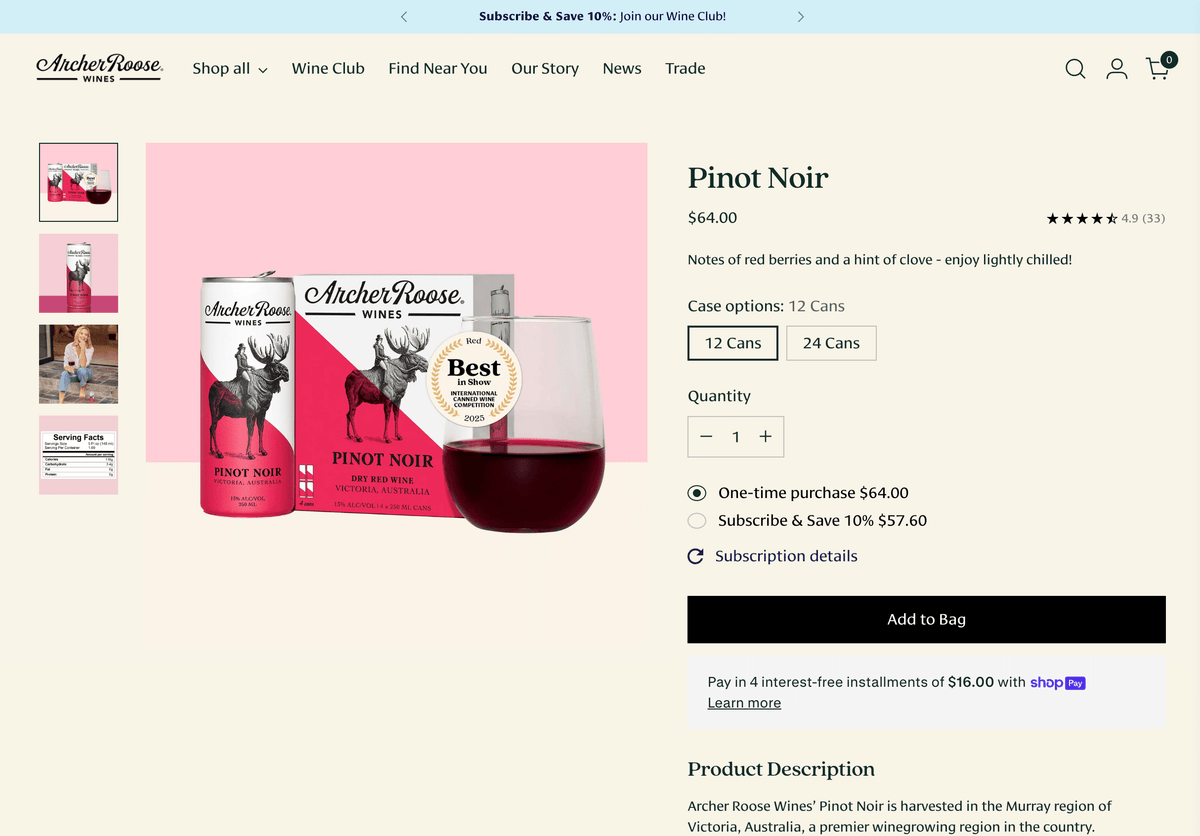
Sell cadence and quantity at signup, before anyone reaches a save offer. Archer Roose, one of our clients, lets subscribers pick 12 or 24 can cases and delivery every 1, 2 or 3 months at checkout.
Three ways NRR misleads you
-
Concentration. A handful of large subscribers expanding can hold the number above 100% while the rest of the base shrinks, so check the GRR gap.
-
Seasonality. A cohort acquired in a Q4 promotion will not behave like a March cohort, so compare like windows.
-
Small bases. Under a few hundred subscribers in a cohort, one large customer moves the number by points, which is why the cohort size belongs next to the percentage every time.
What to pull and how often
Run this on the same day each month so the trend means something.
|
Frequency |
What to pull |
|
Monthly |
NRR and GRR for the fixed cohort, with cohort size |
|
Monthly |
The five components separately: expansion, resumed, contraction, churn, starting revenue |
|
Monthly |
Pause-adjusted NRR beside the strict figure |
|
Quarterly |
Cohort curves, newer against older at the same age |
|
Quarterly |
Subscriber against non-subscriber NRR |
|
Annually |
The anniversary calculation, year two against year three |
Track the components underneath, not just the headline. A store holding 91% for six months while expansion and churn both double is in a completely different position from one where nothing moved. Our Shopify KPIs guide covers the wider metric set if you are building reporting from scratch.
Get a read on your own retention numbers
Retention numbers go wrong in the definitions long before they go wrong in the business. A cohort that drops churned customers, a monthly window that reads every pause as a loss, or a discounted first order in the base year can each move the figure by several points while the store underneath does not change at all.
If you want an outside read on what your base is doing, book a call with our marketing team.
